
In today’s data-driven world, turning numbers into clear insights is more important than ever—and that’s exactly where Microsoft Power BI shines! Whether you’re just dipping your toes into business intelligence or looking to level up your data game, Power BI makes analyzing and visualizing data a breeze.
What is Power BI?
Let’s start with the basics. Power BI is Microsoft’s powerful data visualization and business intelligence tool. It allows you to:
- Connect to a wide range of data sources
- Clean and structure your data
- Build eye-catching visualizations
- Share your insights effortlessly
Why Visualization Matters
Have you ever tried to find trends by scrolling through endless spreadsheet rows? Not fun. With Power BI, visuals like bar plots and dashboards make it easy to spot patterns in seconds. Like discovering your most profitable year with a quick glance at a bar chart!
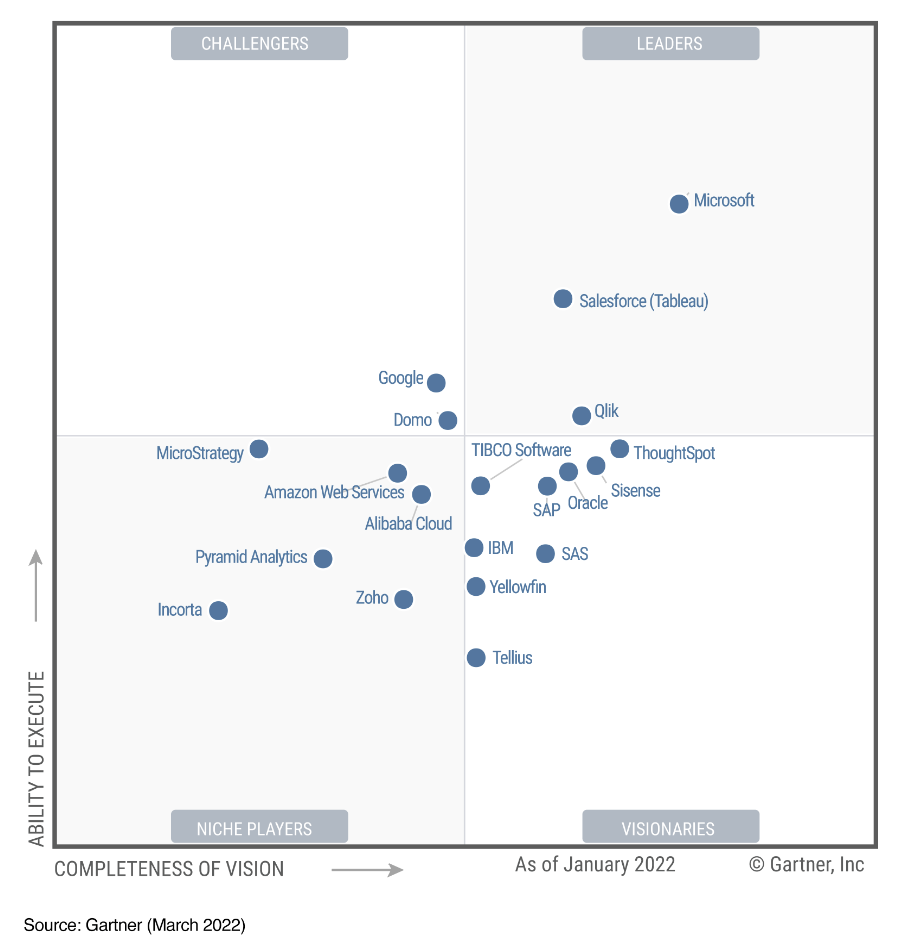
So, Why Power BI?
Great question! While there are many BI tools out there, Power BI is the industry leader. According to Gartner, it tops the BI charts. It’s trusted by 97% of Fortune 500 companies and is used by over six million users worldwide. If you’re serious about data, Power BI is your golden ticket 🎟️.
Power BI Desktop: Your Local Powerhouse
Power BI Desktop is where the magic begins:
- A free, downloadable application
- Includes comprehensive tools like the Query Editor for prepping data
- Enables building reports with charts, slicers, and visuals
🖱️ Everything you build in Desktop can be deployed in the paid versions, so you’re learning skills that scale!
Power BI Service: Share Like a Pro
Once your dashboard is ready, it’s live time! Power BI Service is the cloud platform for publishing, sharing, and collaborating. While a license unlocks full functionality, Power BI Service is ideal for team-based insights, accessible anytime, anywhere.
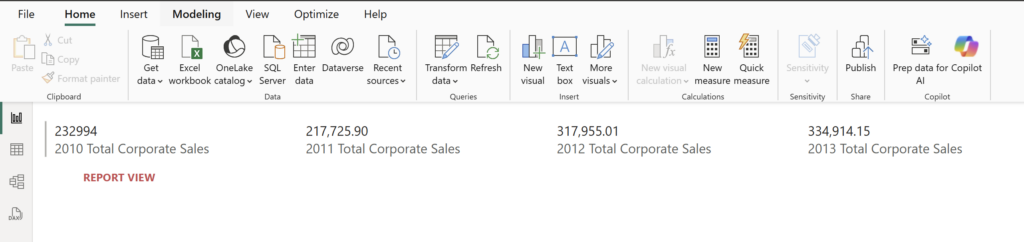
Navigating the Power BI Interface
Here’s what you’ll find when working in Power BI Desktop:
- Four main views – Report, Table, Model, and DAX Query
- Canvas Area – Drag and arrange visuals
- Filters Pane – Refine what’s displayed
- Visualizations Pane – Customize visuals
- Data Pane – See fields to drag into visuals
This layout is intuitive, allowing you to build professional dashboards with ease.
Final Thoughts:
Power BI puts the power of business intelligence at your fingertips. With its robust features and intuitive design, you’re set to become a data storytelling pro.